A new star is born and my new personal favorite if you have to deal with logs: The Log Management solution from https://siglens.com/ together with https://vector.dev/ for log ingestion. This article describes the basic setup and the state of the project per may 2024.
Introduction
For troubleshooting but also for alerting and other purposes a simple and fast log management solution is convenient. But did you already try to use the common simple log solutions out there? If you do you will find typically following solutions (Log Management, Log Ingestion):
- Elasticsearch, Logstash
- Grafana Loki, promtail
- Splunk
The drawback of all those solution is that they are complicated in the meaning of the required setup to get a solution which is working fast. Additional they need a lot of CPU and disk power. Here comes SigLens to the rescue: Small and blazing fast - it is definitly worth to try it out.
Find below the first steps to get it up and running.
Overview
In this example I will setup a simple small instance for my private lab. To get a better overview here is a schematic of the environment:
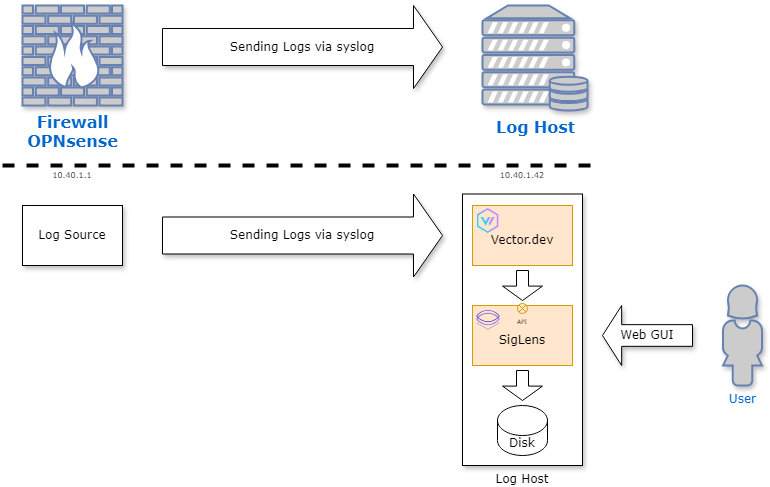
As you can see the environment consists of several components. Here is a short summary in the order of the data flow. More details can be found in the detailed sections about the components:
- OPNsense: Log generator which will send logs over port
9514/udpto the Log Host (with IP10.40.1.42). - Log Host: In my environment this is a virtual machine based on Ubuntu 24.04 LTS. Additional
docker-ceis installed to host the log components:- Vector.dev: Log Collector engine. This engine is written in Rust, is fast and reliable in processing logs. It has the concept of process pipelines:
Sourceswhich reveives data from external systems,transformsto process data and finallysinksto send data to target components (in our case it will be SigLens). - SigLens: The Log Management platform itself. It receives logs over API from ingestors like Vector.dev. It aims API compability with ElasticSearch, Loki and Splunk so you can easily add SigLens as an additional target in your existing deployments to get a feeling about the performance and features of SigLens.
- Vector.dev: Log Collector engine. This engine is written in Rust, is fast and reliable in processing logs. It has the concept of process pipelines:
OPNsense
OPNsense is a well known open source firewall solution. In this example it will be used to send data to the log collection system. For this purpose syslog protocol will be used. Follow this steps to activate syslog forwarding:
- Go to your OPNsense GUI
- Login as admin
- Go to
System→Settings→Logging - On tab
Remoteadd a new entry with the following settings:
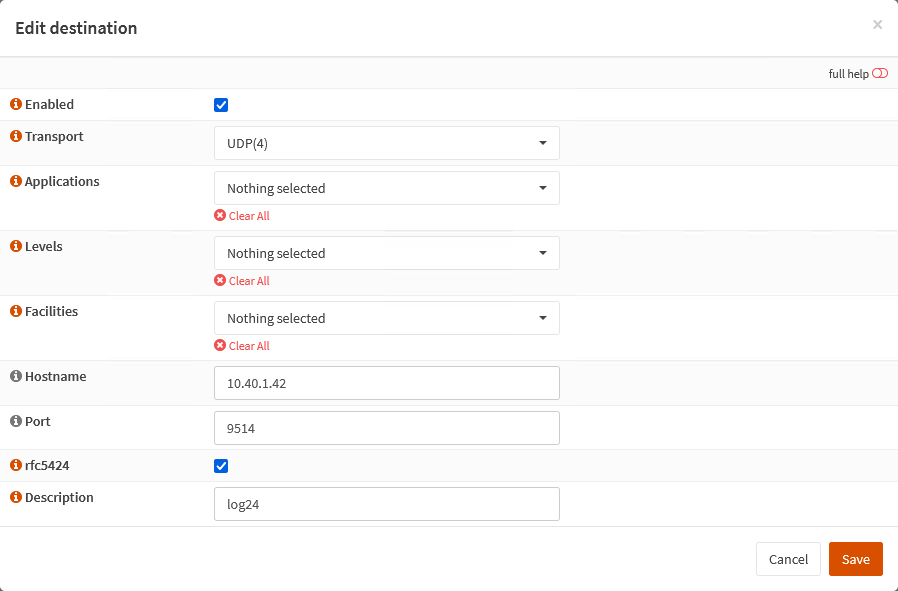
Settings:
- Enabeld:
Checked - Transport:
UDP(4)- Using UDP with IPv4 - Applications:
Noneselected - means that all will send logs - Levels:
Noneselected - we will forward all levels - Facilities:
Noneselected - no restrictions on facilities - Hostname:
10.40.1.42(IP or name of your log host) - Port:
9514- usually 514 is the well known port for syslog based on UDP. But due the fact ports below 1024 needs privileged rights I use in this example 9514. - RFC5424:
Checked- unfortunatly syslog has several dialects - Here I want to use RFC5424 style syslog messages. - Description:
log24- a meaningful description of this log destination
With those settings you are done with the needed changes on your OPNsense box.
Vector.dev
As you saw already in the overview Vector.dev is the workhorse in this environment. It receives logs via syslog on port 9514/udp (called source), processes data (is called transform) and sends finally the processed data to the log management engine (sink which is SegLens).
The following diagram shows the generic pipeline stages:
graph LR;
subgraph sources
end
subgraph transforms
end
subgraph sinks
end
sources --> transforms
transforms --> sinks
Vector.dev provides several possibilities to receive logs. In our example we will setup a so called syslog source which will handle syslog specific tasks like talking the right protocol and pre-processing of received log data. The second part here is essential due syslog has a format how a log line looks like:
<165>1 2024-05-14T10:40:55.003Z mymachine.example.com devd 23312 id1223 Processing event '!System=CAM ...
Source and details see: https://de.wikipedia.org/wiki/Syslog
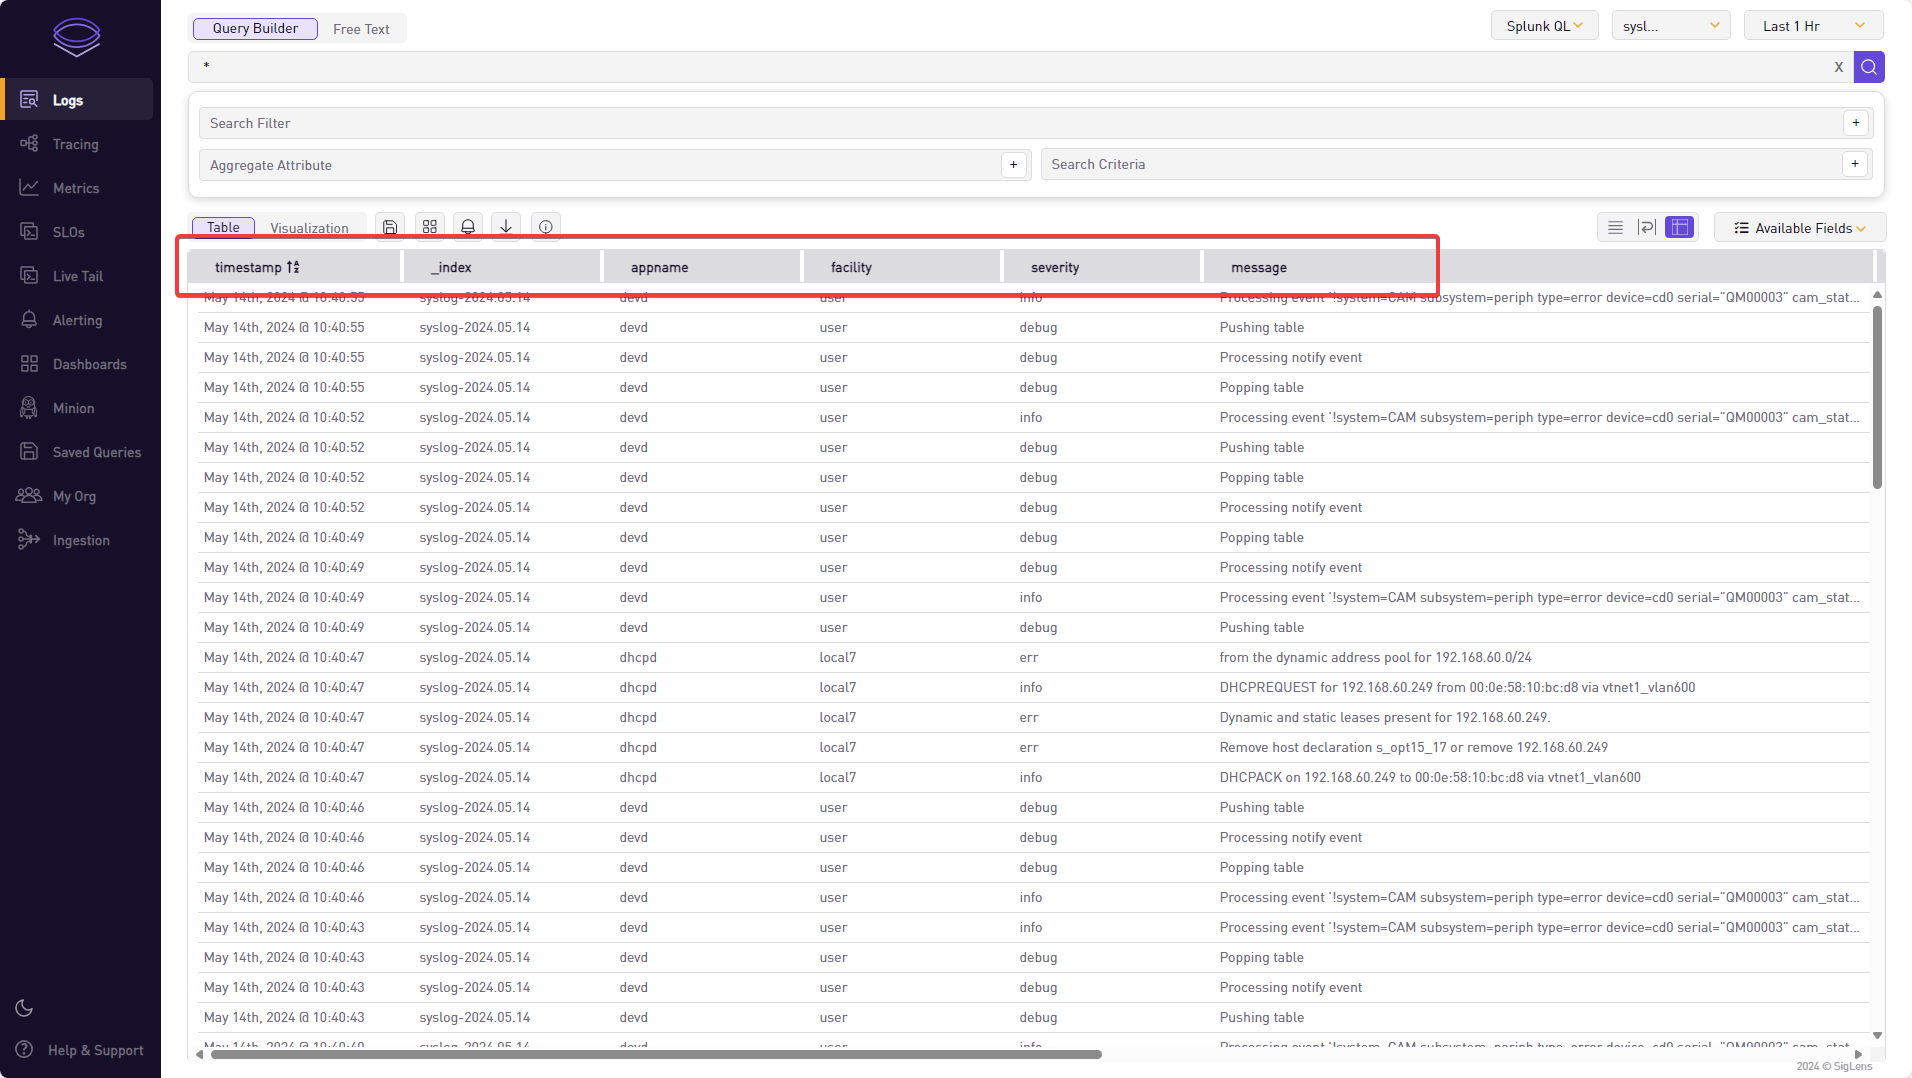
Vector.dev parses the log and pre-populates fields accordingly, eg:
timestamp: Time stamp of the log entryappname: extracted app name (in this exampledevd)facility: in our exampleuserseverity: in our exampleinfomessage: the rest of the syslog message; this is unstructured data. Often here you getkey=valuepairs - but this is dependent on the vendor of the log source._index: Not a syslog field; this is the index where data is stored in the log backend
In our example of processing firewall logs the corresponding message are of interest for us. Due the syslog source already parses the syslog common fields and populates them, it is easy to process the specific logs of the packet filter. They get the appname filterlog. As soon Vector.dev receives such a log line we can do further processing and extract additional data fields.
For this we have to know how such a log line looks like (only message part shown):
186,,,e008a4b10c0402bea597b893198832b4,vtnet1_vlan300,match,pass,in,4,0x0,,63,59816,0,DF,17,udp,80,172.31.240.230,172.31.240.5,54390,53,60
Just from checking the log line it is obvious that this log shows you an accepted (pass) udp connection. Without detailed knowledge about the format it is difficult to know in which direction the communication was done (from 172.31.240.230 to 172.31.240.5 or vice versa?).
That is the reason why we want to extract more specific data out of this message. For this purpose it is helpful if the vendor has an accurate documentation about the format of the logs. In our case we have luck and details are available here: https://docs.netgate.com/pfsense/en/latest/monitoring/logs/raw-filter-format.html
With that information we are able to write an appropriate transform section which extracts appropriate data and creates fields for them (see following section Configuration).
Example of fields to extract (refer to the transform section in the configuration below):
action: typical actions for a firewall areblockandpass(accept)source_ip,source_portdestination_ip,destination_port
Configuration
With the configuration file below we will achieve the things mentioned before. As an overview here a schematic diagram regarding the building blocks of the log processing pipeline:
graph LR;
subgraph sources
A[source_syslog_udp]
end
subgraph transforms
B[filterlog]
C[syslog_catch_all]
end
subgraph sinks
D[siglens_firewall]
E[siglens_syslog]
end
A-->B
A-->C
B-->D
C-->E
D-->F[SigLens ElasticSearch API]
E-->F[SigLens ElasticSearch API]
Most important components of the configuration:
source_syslog_udp: Defines how the component receives logs (source)filterlog: Specifictransformsection to parse the message part of the syslog message from our OPNsense firewall. It will only process data ifappnameis equal tofilterlog. Else it will abort processing due normal syslog messages should be processed by the nexttransformationcalledsyslog_catch_all.syslog_catch_all: This block will process all syslog messages except those withappnameequal tofilterlog.siglens_firewall: Definition where to send processed log data (sink). We will use indexfirewall-%Y.%m.%d.siglens_syslog: Definition where to send processed log data (sink). We will use indexsyslog-%Y.%m.%d.
And finally here the full configuration file vector.yaml:
sources:
  source_syslog_udp:
    type: syslog
    address: 0.0.0.0:9514
    mode: udp

transforms:
  filterlog:
    type: remap
    inputs:
      - source_syslog_udp
    source: |
      if .appname != "filterlog" {
        abort
      }

      filter_parts = split(string!(.message), ",", limit: 10)

      # field extraction
      .rulenr         = to_int!(filter_parts[0])  # 98
      .field2         = filter_parts[1]           # Unknown
      .field3         = filter_parts[2]           # Unknown
      .rid            = filter_parts[3]           # fae559338f65e11c53669fc3642c93c2
      .interface      = filter_parts[4]           # vtnet1_vlan400
      .reason         = filter_parts[5]           # match
      .action         = filter_parts[6]           # pass
      .dir            = filter_parts[7]           # out
      .ipversion      = to_int!(filter_parts[8])  # 4

      if (.ipversion != 4) {
        log("Not supported IP Version!!!", level: "error")
        abort
      }

      filter_parts = split(string!(.message), ",", limit: 9 + 8 + 3 + 1)
      .tos            = filter_parts[9]            # 0x0
      .ecn            = filter_parts[10]           # unknown
      .ttl            = to_int!(filter_parts[11])  # 62
      .id             = to_int!(filter_parts[12])  # 56328
      .offset         = to_int!(filter_parts[13])  # 0
      .flags          = filter_parts[14]           # DF
      .protocol_id    = to_int!(filter_parts[15])  # 6
      .protocol_text  = downcase!(filter_parts[16]) # icmp

      .length         = to_int!(filter_parts[17])  # 56
      .source_ip      = filter_parts[18]           # 172.31.240.230
      .destination_ip = filter_parts[19]           # 172.31.224.17

      # TCP
      if .protocol_id == 6 {
        filter_parts = split(string!(.message), ",", limit: 9 + 8 + 3 + 9 + 1)
        .source_port      = filter_parts[20]
        .destination_port = filter_parts[21]
        .data_length      = filter_parts[22]
        .tcp_flags        = filter_parts[23]
        .sequence_number  = filter_parts[24]
        .ack_number       = filter_parts[25]
        .tcp_window       = filter_parts[26]
        .urg              = filter_parts[27]
        .tcp_options      = filter_parts[28]
      }

      # UDP
      if .protocol_id == 17 {
        filter_parts = split(string!(.message), ",", limit: 9 + 8 + 3 + 3 + 1)
        .source_port      = filter_parts[20]
        .destination_port = filter_parts[21]
        .data_length      = filter_parts[22]
      }

      # ICMP
      if .protocol_id == 1 {
        filter_parts = split(string!(.message), ",", limit: 9 + 8 + 3 + 1 + 1)
        .icmp_type        = filter_parts[20]
      }

  syslog_catch_all:
    type: remap
    inputs:
      - source_syslog_udp
    source: |
      if (.appname == "filterlog") {
        abort
      }

sinks:
  siglens_firewall:
    type: elasticsearch
    inputs:
      - "filterlog"
    endpoints:
      - http://host.docker.internal:8081/elastic/
    mode: bulk
    bulk:
      index: "firewall-%Y.%m.%d"
    healthcheck:
      enabled: false

  siglens_syslog:
    type: elasticsearch
    inputs:
      - "syslog_catch_all"
    endpoints:
      - http://host.docker.internal:8081/elastic/
    mode: bulk
    bulk:
      index: "syslog-%Y.%m.%d"
    healthcheck:
      enabled: false
Running
To run Vector.dev we use Docker. To start our container with the configuration file issue following command:
docker run \
  -d \
  -v $PWD/vector.yaml:/etc/vector/vector.yaml:ro \
  -p "9514:9514/udp" \
  --add-host=host.docker.internal:host-gateway \
  --name vector \
  timberio/vector:latest-alpine
Please note that we have to map the port 9514/udp to the container due we want to be able to receive syslog over UDP.
Check your running instance of Vector.dev with:
docker logs vector
and you should see a similiar output to the following:
2024-05-14T05:17:04.277119Z  INFO vector::app: Log level is enabled. level="info"
2024-05-14T05:17:04.277606Z  INFO vector::app: Loading configs. paths=["/etc/vector/vector.yaml"]
2024-05-14T05:17:04.636469Z  INFO vector::topology::running: Running healthchecks.
2024-05-14T05:17:04.636615Z  INFO vector::topology::builder: Healthcheck disabled.
2024-05-14T05:17:04.636622Z  INFO vector::topology::builder: Healthcheck disabled.
2024-05-14T05:17:04.636626Z  INFO vector: Vector has started. debug="false" version="0.38.0" arch="x86_64" revision="ea0ec6f 2024-05-07 14:34:39.794027186"
2024-05-14T05:17:04.636636Z  INFO vector::app: API is disabled, enable by setting `api.enabled` to `true` and use commands like `vector top`.
2024-05-14T05:17:04.636851Z  INFO source{component_kind="source" component_id=source_syslog_udp component_type=syslog}: vector::sources::syslog: Listening. addr=0.0.0.0:9514 type="udp"
SigLens
Finally the last and most important piece in our log management solution. It is also much easier to understand and configure compared to the log collector based on Vectra.dev because the heavy load is already done and SigLens just provides an API where Vectra.dev (and similar components) can deliver logs to.
Configuration
Most important components of the configuration:
ingestPort: Defines the port for the API access (in our example Vectra.dev will use this port to deliver logs to SigLens)queryPort: Defines the port for Web UI accessretentionHours: Defines how many hours data should be kept
Here is the configuration file for SigLens with the name siglens.yaml:
---
## IP and port for SigLens ingestion server
ingestListenIP: 0.0.0.0
ingestPort: 8081

## IP and port for SigLens query server, including UI
queryListenIP: 0.0.0.0
queryPort: 5122

## Location for storing local node data
dataPath : data/

## field name to use as a timestamp key
timestampKey : timestamp

pqsEnabled: false

## Elasticsearch Version for kibana integration
esVersion: "7.9.3"

## Number of hours data will be stored/retained on persistent storage.
retentionHours: 360 # max 15 days possible! (hard limit in source code)

## Percent of available RAM that siglens will occupy
# memoryThresholdPercent: 80

## For ephemeral servers (docker, k8s) set this variable to unique container name to persist data across restarts:
# the default ssInstanceName is "sigsingle"
ssInstanceName: "sigsingle"

log:
  logPrefix : ./logs/

  ## Maximum size of siglens.log file in megabytes
  logFileRotationSizeMB: 100

  ## Compress log file
  compressLogFile: true

# TLS configuration
tls:
  enabled: false   # Set to true to enable TLS
  certificatePath: ""  # Path to the certificate file
  privateKeyPath: ""   # Path to the private key file

# SigLens server hostname
queryHostname: ""
Running
To run SigLens we also use docker and use following command (make sure you created necessary directories data and logs before running the container):
docker run \
  -d \
  -e "UI_PORT=5122" \
  -e "CSI=10.40.1.42" \
  -v $PWD/siglens.yaml:/siglens/siglens.yaml:ro \
  -v $PWD/data:/siglens/data \
  -v $PWD/logs:/siglens/logs \
  -p "8081:8081" \
  -p "5122:5122" \
  --name siglens \
  siglens/siglens:latest \
  ./siglens --config siglens.yaml
Check your running instance of SigLens with:
docker logs siglens
and you should see a similiar output to the following:
time="2024-05-14T05:16:55Z" level=info msg="Initialized FD limiter with 367001 as max number of open files"
time="2024-05-14 05:16:55" level=info msg="Extracting config from configFile: siglens.yaml"
time="2024-05-14 05:16:55" level=info msg="Tracing is disabled. Please set the endpoint in the config file to enable Tracing."
time="2024-05-14 05:16:55" level=info msg="ReadRunModConfig:Config file 'data/common/runmod.cfg' does not exist. Awaiting user action to create it."
time="2024-05-14 05:16:56" level=info msg="----- Siglens server type SingleNode starting up ----- \n"
time="2024-05-14 05:16:56" level=info msg="----- Siglens Ingestion server starting on 0.0.0.0:8081 ----- \n"
time="2024-05-14 05:16:56" level=info msg="----- Siglens Query server starting on 0.0.0.0:5122 ----- \n"
time="2024-05-14 05:16:56" level=info msg="----- Siglens UI starting on 0.0.0.0:5122 ----- \n"
GUI Access
Now open your favorite web browser and surf to your host and port 5122, eg. according our example http://10.40.1.42:5122/
Here an example query running over all data: * | action="block" | stats count(destination_ip) as Count by destination_ip | sort -Count:
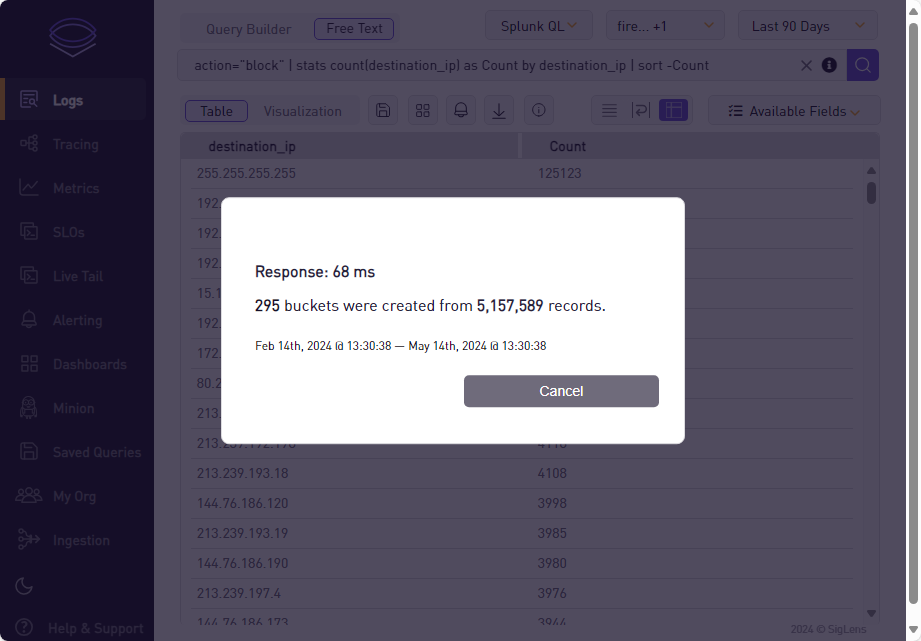
Actually about 5 GByte of Log data is collected with about 5 Mio log lines. The query took only 68ms - this is blazing fast!!! And this performance out of a simple virtual machine running on a low end CPU and data on SSD. I’m really impressed and is my new choice for log management.
Summary
A new star is born - that’s my simple conclusion. I’m impressed about the simplicity and performance of SigLens. Of course it is far away from feature complete - but the base is there and can already be used for many use cases.
One simple case I showed in the chapter above (GUI Access) - it took about 68ms to search and count over 5 million log lines over the range of two days (accumulated volume of 5 GByte).
I’m pretty sure that this article wouldn’t be the last one about SigLens.
FAQ
I can’t see any logs in SigLens
Make sure that you really receive logs from your source system. For this log into your log host as root and execute following command:
tcpdump -nnAi any port 9514
You should see something similar to:
root@log24:/home/rOger# tcpdump -nnAi any port 9514
tcpdump: data link type LINUX_SLL2
tcpdump: verbose output suppressed, use -v[v]... for full protocol decode
listening on any, link-type LINUX_SLL2 (Linux cooked v2), snapshot length 262144 bytes
12:26:09.938056 eth0  In  IP 10.40.1.1.57162 > 10.40.1.42.9514: UDP, length 255
E.......@...
(..
(.*.J%*..>.<134>1 2024-05-14T12:26:09+02:00 fw24.eisenecher.private filterlog 71579 - [meta sequenceId="1222476"] 21,,,0,vtnet1_vlan300,match,rdr,in,4,0x0,,64,55958,0,DF,6,tcp,60,172.31.240.226,80.219.20.246,52632,443,0,S,2941091984,,29200,,mss;sackOK;TS;nop;wscale

...<shorted>...

^C
240 packets captured
547 packets received by filter
0 packets dropped by kernel
root@log24:/home/rOger#
If you see similar lines on your screen check next if Vector.dev is up and running and is not spitting out error messages by calling:
docker logs vector
Additional it could take up to 3 minutes until you see anything in the GUI of SigLens (seems to be a known bug )
Why did you use two dedicated transform sections?
In the Vector.dev configuration you saw that I used two dedicated transform sections: filterlog and syslog_catch_all. This is done so in the next stage (sink) data can flow in dedicated indexes in the log backend (index firewall-%Y.%m.%d vs. syslog-%Y.%m.%d).
Can I extend retention to more than 15 days?
No. This is currently (based on release 0.2.4) not possible due hard limit in code.
I created a dashboard some days ago - now it shows nothing
You have in mind that the selected indexes get also saved when you save your dashboard. So if you use an index on a daily basis like firewall-%Y.%m.%d your dashboard would not show data if you call it eg. two days later. This is currently a limitiation in version 0.2.4 and should be more flexibel in the future.
Can access to SigLens be protected?
Yes. In an upcoming enterprise version it will be a standard feature. In the actual development branch (which is open source) there is no integrated functionality. So for this purpose you have to put your SigLens instance behind a reverse proxy which will do the whole authentication task.
Update from 14.05.2024: I was successful to place SigLens instance behind Azure Application Proxy - so I could use powerfule Entra ID authentication with MFA and Conditional Access to protect my SigLens instance.
Further Reading
Here are some links:
- ElasticSearch: https://www.elastic.co/elasticsearch , Logstash: https://www.elastic.co/logstash
- Grafana Loki: https://grafana.com/docs/loki/latest/ , Promtail: https://grafana.com/docs/loki/latest/send-data/promtail/
- Splunk: https://www.splunk.com/
- OPNsense: https://opnsense.org/
- Ubuntu 24.04 LTS: https://ubuntu.com/download/server
- SigLens Log Management Solution written in golang: https://siglens.com/
- Vector.dev Log Ingestion and Transform Engine written in Rust: https://vector.dev/
- RFC5424: https://datatracker.ietf.org/doc/html/rfc5424
- OPNsense and PFsense based filter log format documentation: https://docs.netgate.com/pfsense/en/latest/monitoring/logs/raw-filter-format.html
- Docker: https://www.docker.com/